
JFrog ML Architecture
Explore the architecture that makes JFrog ML a single, trusted platform for MLOps.
Overview
JFrog ML is a unified platform designed to streamline the entire machine learning lifecycle by integrating MLOps, security, and DevOps into a single system of record. It provides a robust, scalable, and secure foundation for building, deploying, and monitoring your models in production.
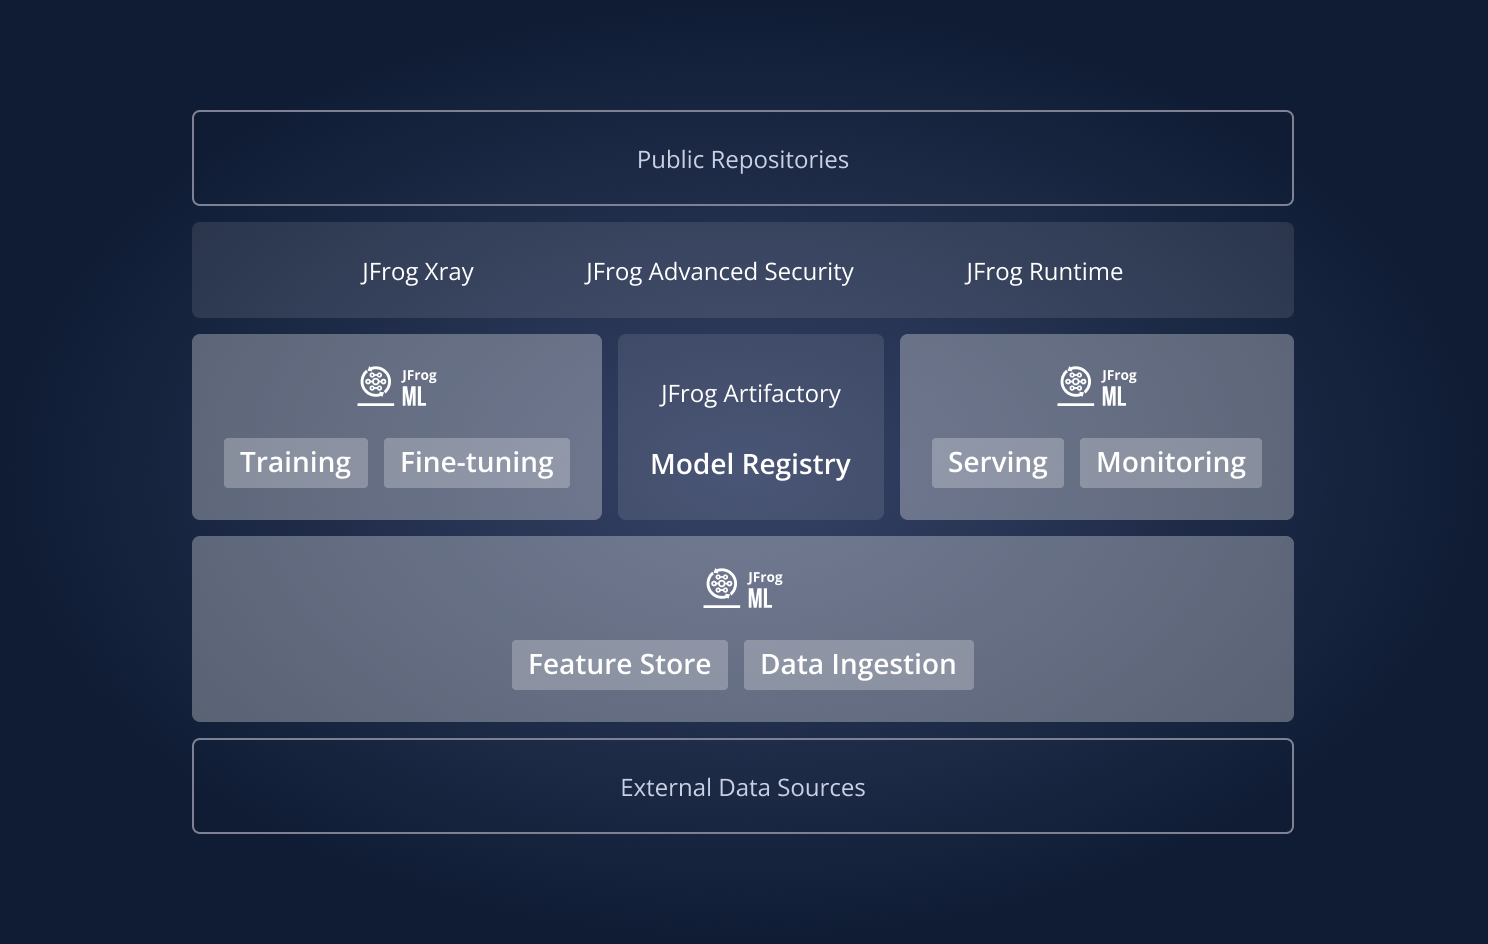
At its core, the architecture leverages the power of the JFrog Platform. JFrog Artifactory serves as the central, immutable Model Registry, providing versioning, traceability, and governance for all ML models and their dependencies. Security is embedded at every stage, with JFrog Xray performing deep scanning of models, containers, and artifacts to proactively identify vulnerabilities and license compliance issues.
This document outlines the architecture that enables this powerful combination of flexibility and security.
High Level Architecture
The JFrog ML architecture is fundamentally based on a separation of concerns, divided into two distinct components: the JFrog ML Control Plane and the JFrog ML Data Plane.
This design ensures that sensitive data and computational workloads remain isolated within a secure environment, while orchestration and metadata management are handled centrally.
.svg")
JFrog ML high level overview
JFrog ML Control Plane
The Control Plane is the centralized orchestration and management layer, securely hosted and managed by JFrog. It serves as the brain of the system, coordinating all activities without ever accessing sensitive customer data or models. Its sole focus is on metadata, workflow management, and state tracking.
Core Responsibilities
- Orchestration & Metadata Management: Manages all non-sensitive metadata for entities such as Models, Builds, Pipelines, and Deployments. This includes tracking versions, parameters, and relationships between these entities.
- Orchestration & Workflow Management: Coordinates multi-step workflows such as build, deploy, promote and monitor and delegates sensitive operations to the Data Plane.
- Delegation & Status Reporting: Sends requests to the Data Plane and receives operation updates (e.g., build progress, deployment status).
JFrog ML Data Plane
The Data Plane is the secure execution environment where all sensitive data processing, model computation, and artifact storage occurs. This plane is deployed either in JFrog's secure cloud (for a fully managed SaaS experience) or directly within a customer's own cloud environment/VPC (for a hybrid deployment). This flexibility ensures data sovereignty and allows for integration with private data sources via mechanisms like VPC Peering or AWS PrivateLink.
Core Responsibilities
- Secure Execution Environment: Executes all computational workloads, including model training jobs, build processes, and batch inference tasks.
- Model Repository & Artifact Storage: Stores models, artifacts, and associated metadata in encrypted registries or object stores.
- Feature Store: Manages the storage and retrieval of feature data for training and real-time inference.
- Inference Lake: Collects and stores model prediction logs, ground truth data, and operational metrics for monitoring and analysis.
- Real-time Model Serving: Manages the deployment of models as scalable, high-availability endpoints, complete with built-in monitoring and logging.
- Compute & Autoscaling Management: Provisions the necessary compute resources for all jobs and manages the autoscaling of model endpoints based on real-time traffic, latency, or custom metrics.
For encryption, data classification, and physical security controls, see: JFrog Cloud Data Security Addendum.
Workflows Across the Planes
The interaction between the Control Plane and Data Plane is best illustrated through common MLOps workflows.
Model Build & Scan
- Build Trigger: A user, via the JFrog ML CLI or SDK, initiates a jfrog ml build command. The request is authenticated by the Control Plane, which creates a unique build ID and records the initial metadata.
- Code Upload: The Control Plane provides a secure, pre-signed URL for the user's client to upload the model source code directly to a staging area within the Data Plane.
- Build & Scan Execution: The Data Plane picks up the job, builds the model code into a containerized artifact, and runs predefined tests. Critically, it then invokes JFrog Xray to scan the resulting artifact and its dependencies for security vulnerabilities.
- Store in Artifactory: Upon a successful and clean scan, the Data Plane pushes the versioned, immutable model artifact to its designated repository in JFrog Artifactory.
- Build Status Update: The Data Plane reports the final status (including the Artifactory path and Xray scan results) back to the Control Plane, which updates the model's metadata, making it available for deployment.
Model Deployment
- Deployment Request: A user requests to deploy a specific model version (e.g., model-a:1.2.0). The Control Plane verifies the user's permissions and checks that the requested model version exists and has passed all required security gates.
- Deploy Command: The Control Plane issues a secure command to the Data Plane, instructing it to deploy the validated model version.
- Deployment Execution: The Data Plane pulls the specific, versioned model artifact directly from JFrog Artifactory. It then provisions the necessary resources and deploys the model as a scalable inference endpoint.
- Deployment Status Update: The Data Plane continuously reports the deployment's health, endpoint URL, and replica count back to the Control Plane, providing a live operational view to the user.
Autoscaling ML Endpoint
This workflow ensures that model endpoints remain performant and cost-efficient under variable load without manual intervention.
- Monitor Metrics: The Data Plane continuously monitors real-time performance metrics for each deployed model, such as request rate (RPS), P95 latency, error rates, and CPU/GPU utilization.
- Scale Autonomously: Based on pre-defined autoscaling policies, the Data Plane autonomously adjusts the endpoint's resources. This can involve scaling out by adding replicas to handle traffic spikes or scaling in by removing them during idle periods to optimize costs.
- Report State: The Data Plane reports the new scaling state, current replica count, and overall health summary back to the Control Plane. This ensures that the platform's UI and API always reflect the endpoint's real-time operational status.
Feature Store Execution
This workflow automates the computation and refreshing of feature sets for training and inference.
- Trigger Execution: Based on a schedule, an event, or a manual API request, the Control Plane initiates a feature set computation job.
- Execute Job: The Control Plane delegates the task to the Data Plane, which runs the feature engineering logic (e.g., joins, transformations, aggregations) using its secure compute resources.
- Store Results: The Data Plane saves the computed feature values to the Feature Store's storage layer, making them available for low-latency retrieval by training jobs or inference services.
- Update Status: The Data Plane reports the job's completion status, health, and execution metrics (e.g., rows processed, errors) back to the Control Plane for central tracking and observability.
Control and Data Plane Separation
This architectural separation is a deliberate design choice and is highly important. It provides significant advantages for security, scalability, and governance.
- Enhanced Security & Data Sovereignty: Your proprietary models, sensitive training data, and intellectual property never leave the Data Plane. In a hybrid deployment, this means your assets remain within your cloud account's security perimeter, satisfying strict data sovereignty and compliance requirements (e.g., GDPR, HIPAA).
- Governance & Audit: All actions are initiated and tracked through the Control Plane, creating a single, auditable source of truth for the entire ML lifecycle. You can see who built, scanned, and deployed every model, enabling clear governance and simplifying compliance checks.
- Scalability & Performance: The execution-focused Data Plane can be scaled independently of the management layer. It can be geographically located close to your data sources or end-users to minimize latency and optimize performance, without affecting the central control plane.
- Operational Efficiency: This architecture unifies the MLOps experience. Your teams interact with a single, coherent platform for all tasks, from experimentation to production monitoring. This eliminates the complexity and security gaps associated with stitching together disparate tools for model storage, security scanning, deployment, and monitoring.
Updated about 1 month ago