Model Monitors
Monitor performance and data anomalies using real time analytics
Overview
Monitoring model data plays a pivotal role in the lifecycle of machine learning models, particularly when deploying models in production environments.
JFrog ML model monitoring helps you to track selected model inputs and outputs, while enabling automatic alerts for detecting data inconsistencies.
Beta FeatureModel monitoring is currently in beta phase, and is being actively developed and refined. We're continuously working to improve features and performance based on valuable user feedback.

Monitoring KL divergence
Please configure Slack channels to which alerts are sent before setting up new monitors.
KL divergence measures the difference between the probability distributions of the model predictions and the actual outcomes, using the Kullback-Leibler (KL) divergence. This helps detect data discrepancies and assess model performance over time.
Creating KL divergence monitors
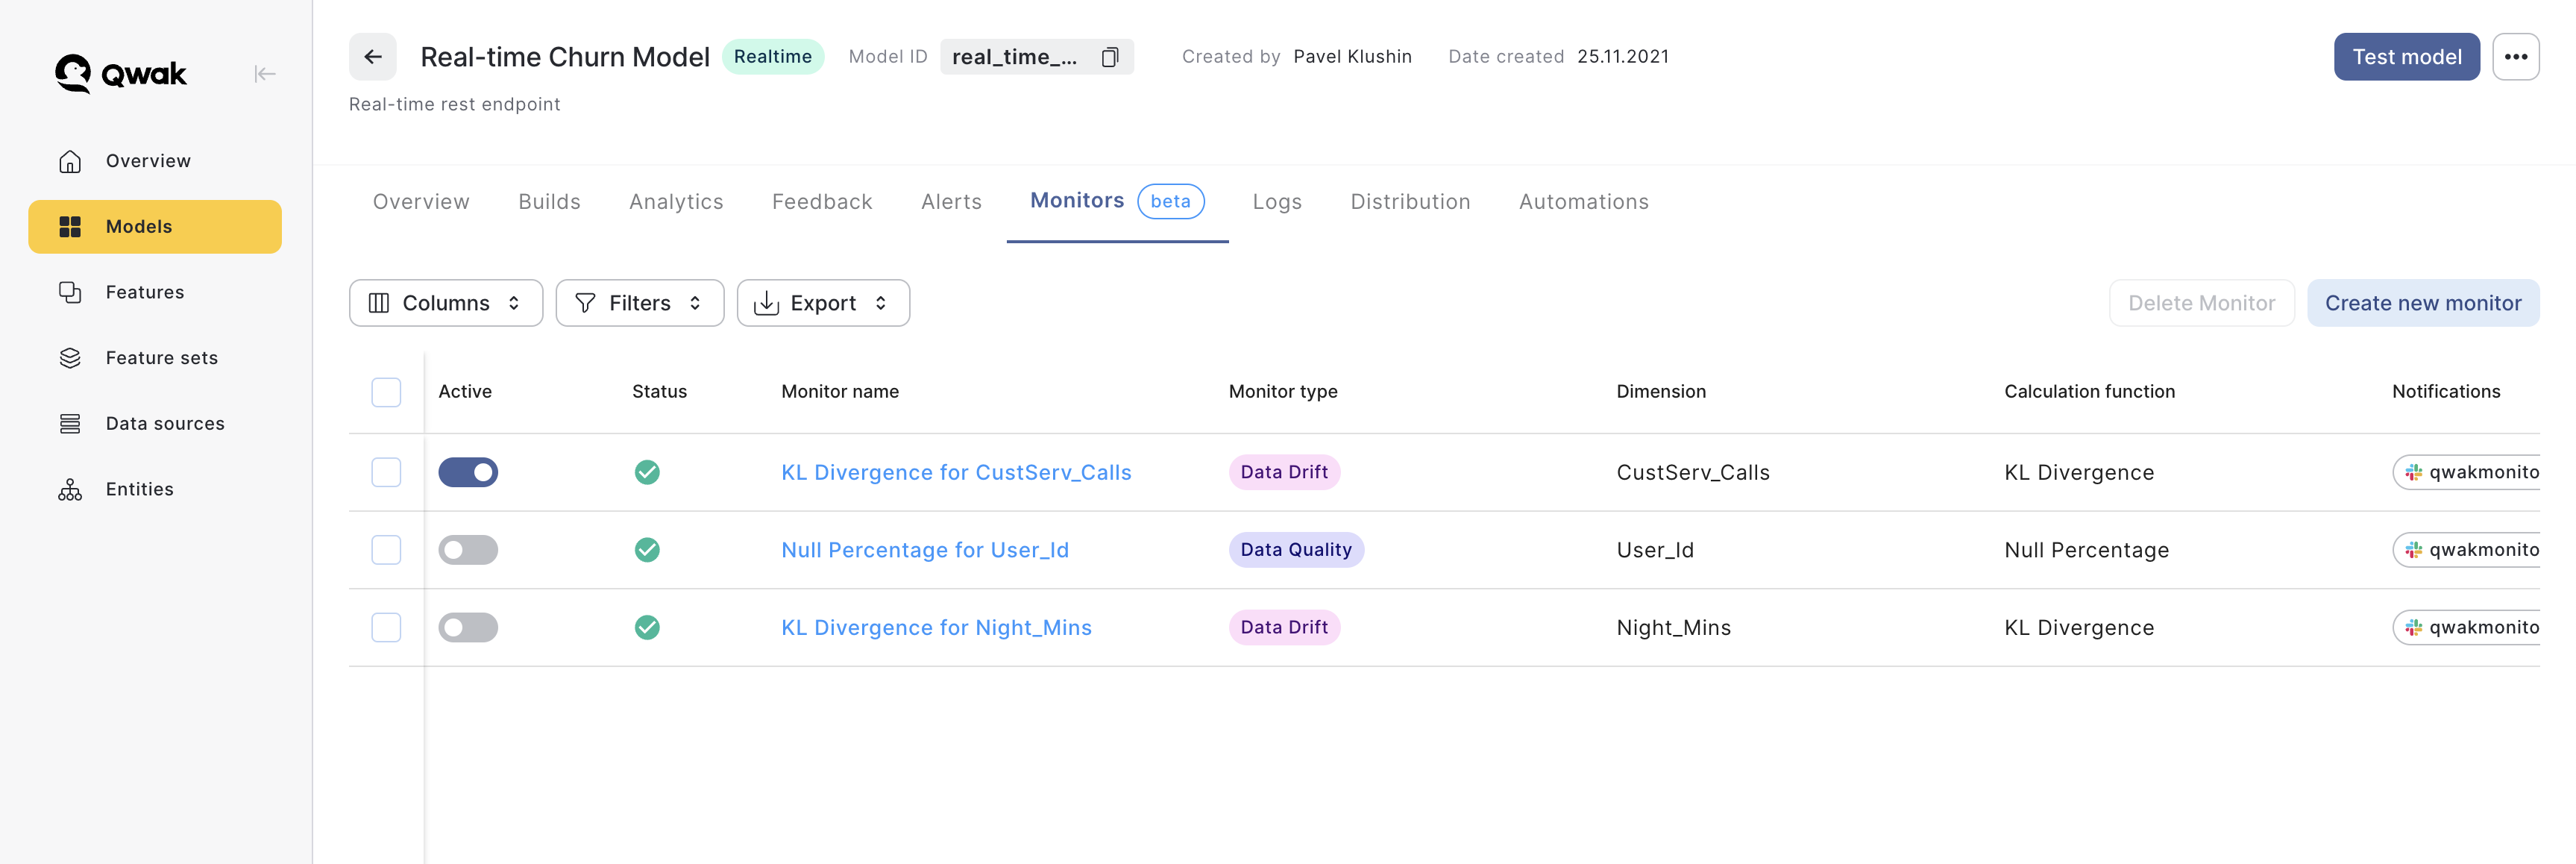
Creating a new model monitor can be done in several simple steps:
-
Select the Model: Choose the specific model that you want to monitor.
-
Navigate to Monitors: Head over to the 'Monitors' tab in your model, where monitors are managed.
-
Create a New Monitor: Create a new monitor by clicking 'Create Monitor'
-
Choose Calculation Method: Select the KL Divergence calculation function
-
Select Monitoring Dimension: Indicate the dimension you wish to monitor, either a model input or output.
-
Define Baseline: Set up a baseline for the calculation, which serves as a reference point to the KL divergence calculation. Further explanations can be found below.
-
Preview Monitor Data: Click 'Preview' to see the monitor data before defining the alert threshold.
-
Set Alert Parameters: Specify the criteria for triggering alerts. Define the threshold and conditions for triggering a monitoring alert.
-
Configure Alert Channels: Decide which Slack channels will received the monitoring alerts.

Using build-based baseline
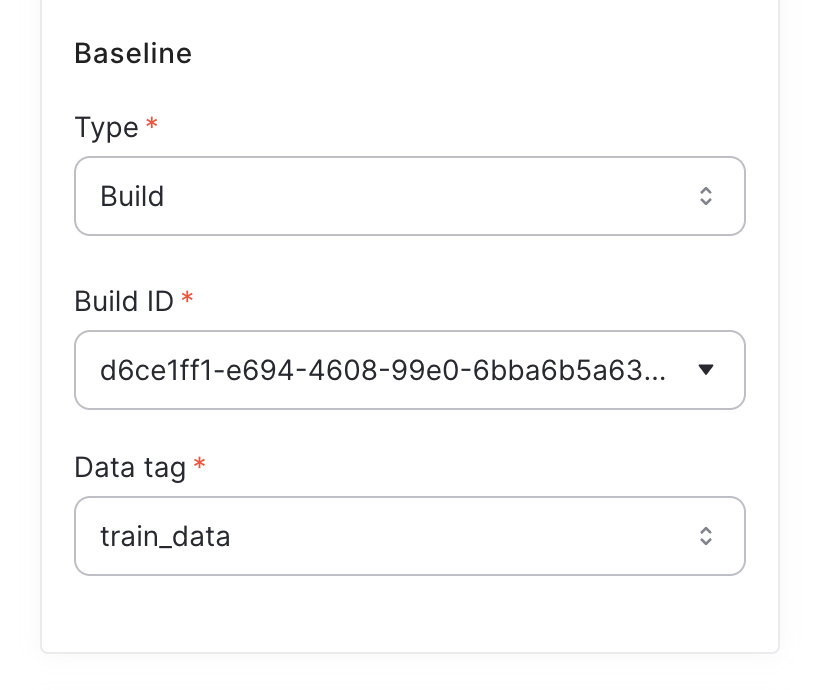
When choosing a build-based baseline, you can choose the training data in one of the previous model builds as a reference point.
When choosing a build-based baseline, the logged data set from that build will be using for KL divergence calculation.
The rocket ship icon indicates the currently deploy build version.
Tagging training dataUsing build-based baseline requires a logging a reference training data during the model build.
Tagging data sets is done by using:
qwak.log_data(dataframe=df, tag="train_data")for example.KL divergence calculation cannot use builds without logged data sets.
Using static baseline
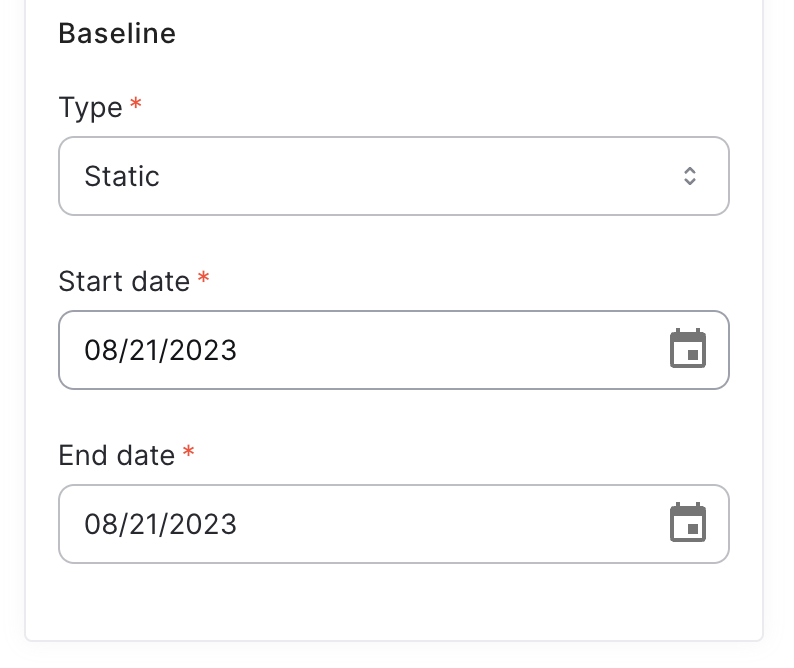
A static baseline defines the timeframe with which KL divergence data will be calculated. The system takes as reference all the received values during this time period and will calculate KL diveregence against it.
Using sliding window baseline
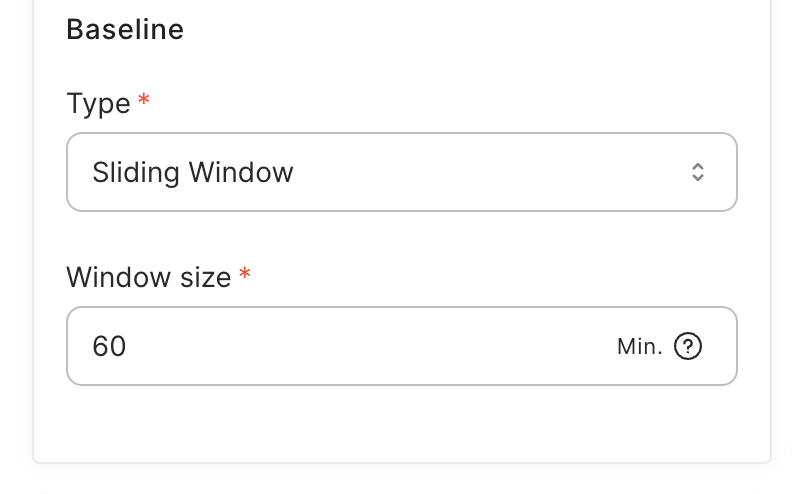
Sliding window is measured in minutes, and specifies the length of the sliding window used for computing KL divergence.
The default sliding window size is 60 minutes.
Monitoring null percentage
Monitoring null percentage refers to tracking and analyzing the proportion of missing or null values in a dataset or a particular feature within a dataset.
Missing values are common, and monitoring their occurrence can be crucial for ensuring the quality and reliability of your models.
Configuring null percentage monitors is simpler compared to KL divergence monitors, as the only required parameter is the dimension you wish to monitor
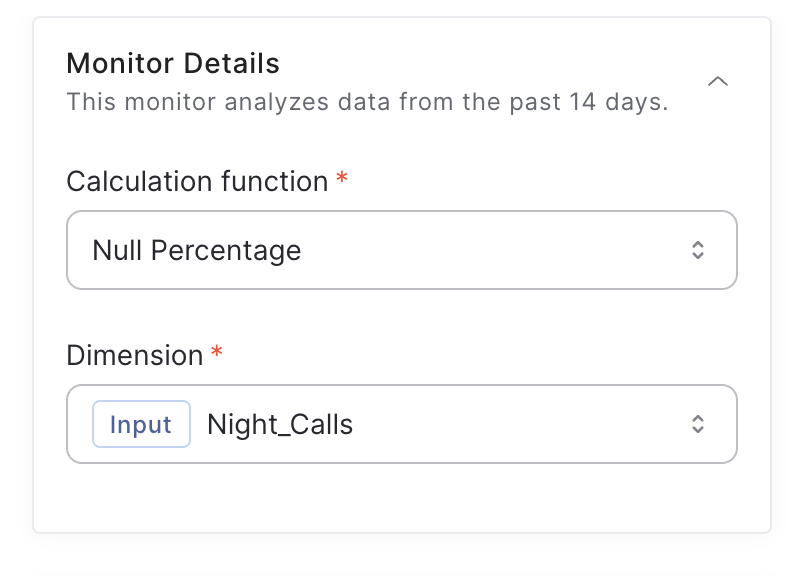
Configuring monitor parameters
Under the Advanced Configuration menu are some additional parameters you may configure:
- Monitor Name: Modify the default monitor name (monitor names are unique)
- Frequency (8 hours): The time interval between sample points within the entire monitoring period.
- Evaluation Window (60 min): The time window to look back at every monitoring sample point.
Configuring alerts
Channels IntegrationsPrior to setting up alerts, please make sure that the relevant integrations and channels are configured. For more information, please see the Alert Integrations guide.
Alerts help you stay up-to-date with your model in real time. After configuring your model monitor details, choose the adequate threshold and alerting condition, whether above or below the threshold value.
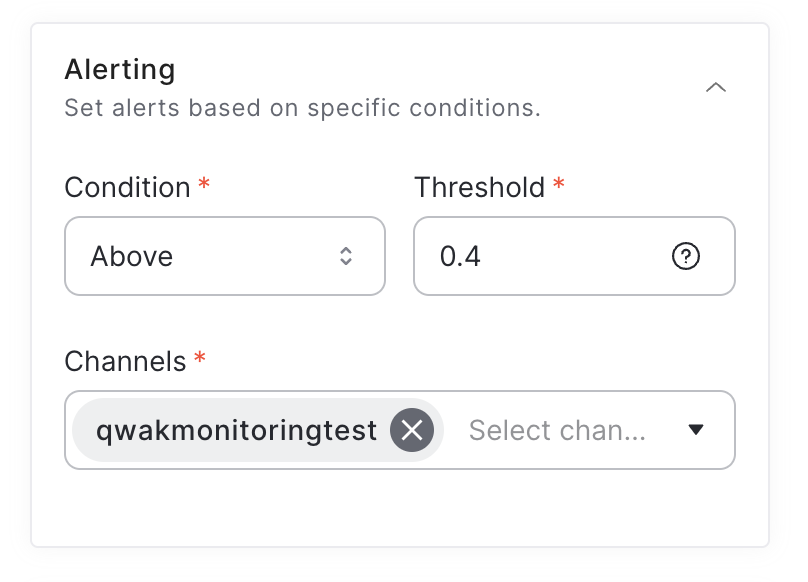
Tags and priority
Tags and priority help you organize model monitor alerts. Tags let you categorize alerts, while priority helps in sorting alerts as they occur.
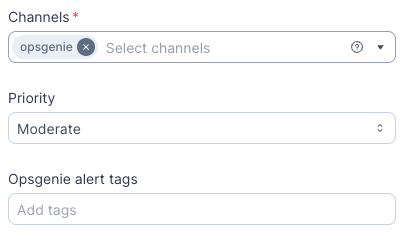
Priority
You can assign an alert priority to your channel. Each priority level will be mapped appropriately to the corresponding integration. Please note that the priority mapping to the different integrations is defined on the platform level.
| Jfrog ML | Opsgenie | Pagerduty | Slack |
|---|---|---|---|
| Critical | P1 | critical | Critical |
| High | P2 | error | High |
| Moderate (default) | P3 | warning | Moderate |
| Low | P4 | info | Low |
| Info | P5 | info | Info |
Tags
You can define up to 20 text tags for your Opsgenie alerts, with each tag having a maximum length of 50 characters.
Note: Tags are supported only for Opsgenie channels.
Updated 7 months ago