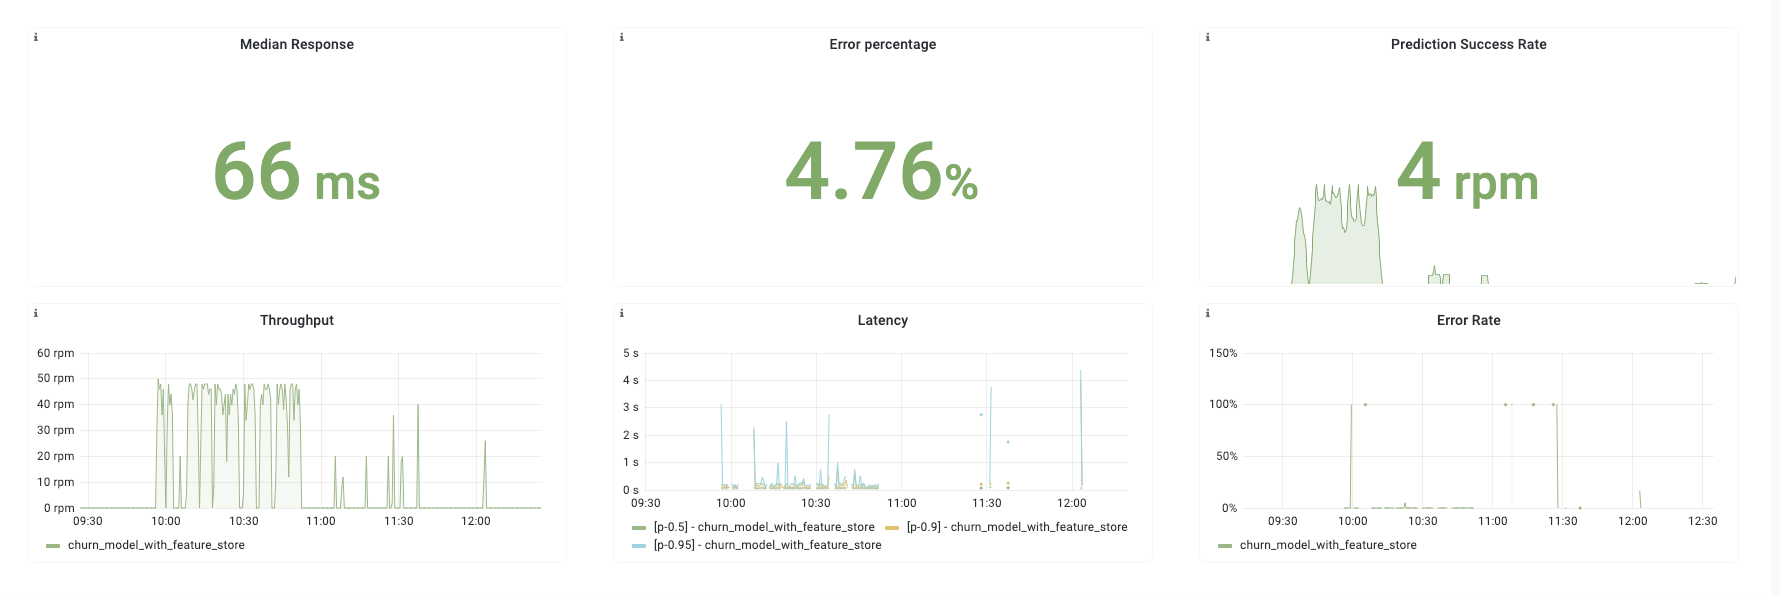
Runtime Metrics
Runtime metrics are track anything about your models over time, from latency to error rates to prediction success rates.
The JFrog ML UI displays the model metrics in the Health in the in the Overview tab.

| Metric | Description |
|---|---|
| Median response | The median time elapsed, in milliseconds, of model inference requests in the last 5 minutes. |
| Error percentage | The percentage of 5XX error type of total request in the last 5 minutes. |
| Predication success rate | The average success inference requests per minute. |
| Throughput | The total amount of requests, in 1-minute long windows. |
| Latency | The time elapsed, in milliseconds, of model inference requests. If one or more of these operations fail, this is the time to fail. |
| Error rate | The percentage of 5XX errors of total request in 1 aggregation of 1-minute metrics to Datadog. |
Exporting metrics to your Grafana
JFrog ML allows to connect to the hosted Prometheus and send metrics to Grafana.
If you wish to export the metrics to your Grafana, please contact [email protected].
Updated 7 months ago