Performance Monitors
Monitor model performance in real time
Monitoring ML model performance on JFrog ML is essential for maintaining the reliability and effectiveness of your models. Our integrated alerting system enables you to effortlessly track key metrics and receive realtime notifications. It seamlessly integrates with your preferred communication and incident management tools, such as Slack, OpsGenie or PagerDuty.
Configuring Infrastructure Monitors

-
Open the model you'd like to monitor and switch to the Monitors tab.
-
Click Create New Monitor -> Infrastructure Monitor.
-
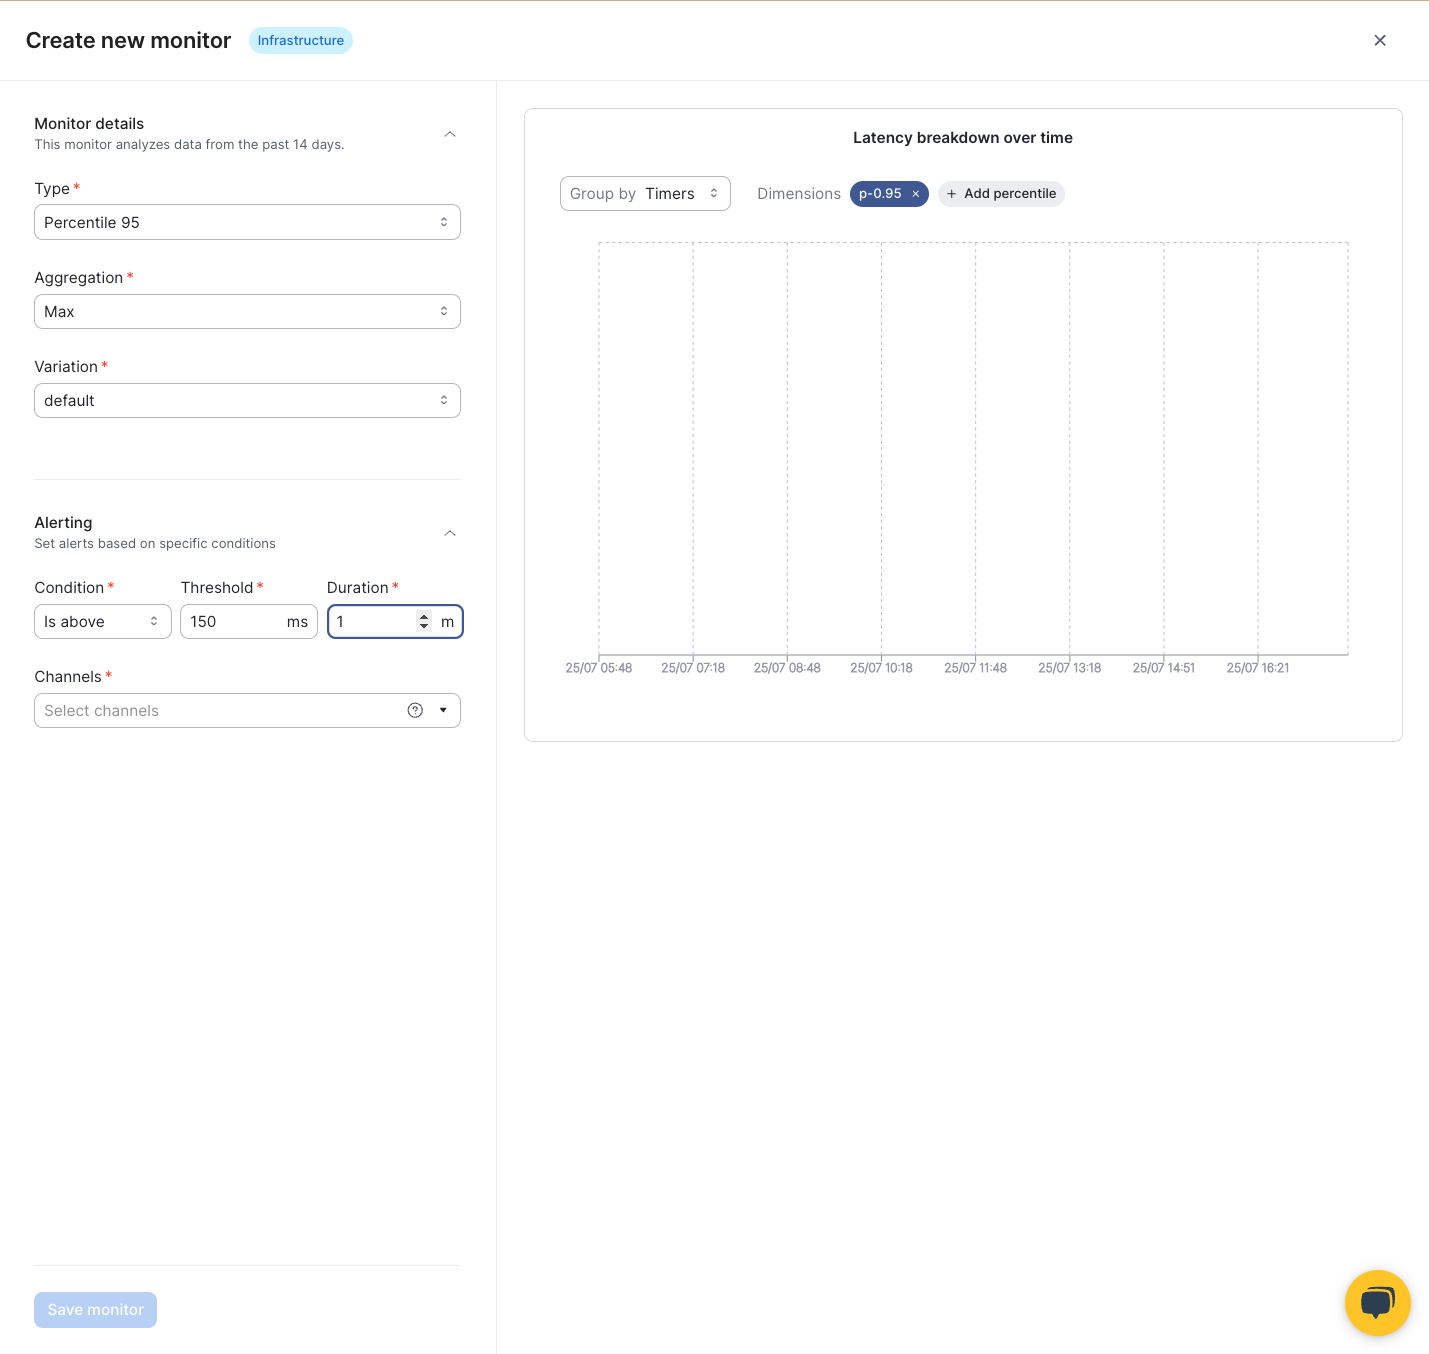
In the Type field, choose the desired metric to alert based on:
- Error Rate refers to how many requests returned an error in the given interval (Duration)
- Throughput refers to the amount of requests per given interval, this is great for a use case where you'd like to be alerted when a scaling policy should kick in.
- Latency 95, 90 and 50 signifies the slowest 5, 10 and 50% of requests (highest latency) from all the requests received in the given interval.
-
In the Aggregation you can select what aggregation is relevant for the monitoring metric.
-
Variation is the model version that you'd like to get alerted on. Generally Default when the model is deployed under one variation only.
-
Under the Alerting tab you will find the Condition, Threshold and the Duration which is the aggregation interval.

-
From the Channels dropdown, select a channel to receive the notifications. If you don't see your channel there, follow the instructions below to add a new channel.
-
Pick which model variant should be tracked or choose "All variations".
-
Remember to save your enable the alert by clicking the Status toggle and save the changes using the Save button!
-
For deployments of type Streaming the only supported alert types are "Error rate" and "Throughput". All alerts of type "Latency" will be automatically disabled. Remember to re-enable those alerts in case you change your deployment time to Realtime
Tags and priority

Priority
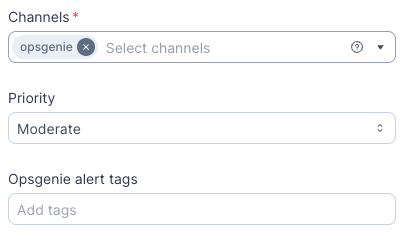
You can assign an alert priority to your channel. Each priority level will be mapped appropriately to the corresponding integration.
| Jfrog ML | Opsgenie | Pagerduty | Slack |
|---|---|---|---|
| Critical | P1 | critical | Critical |
| High | P2 | error | High |
| Moderate | P3 | warning | Moderate |
| Low | P4 | info | Low |
| Info | P5 | info | Info |
Tags
You can define up to 20 text tags for your Opsgenie alerts, with each tag having a maximum length of 50 characters.
Can be used only for the Opsgenie integration.
Configuring Channels
For channels integrations you can follow the next instruction: https://docs.qwak.com/docs/alert-integrations
Updated 7 months ago